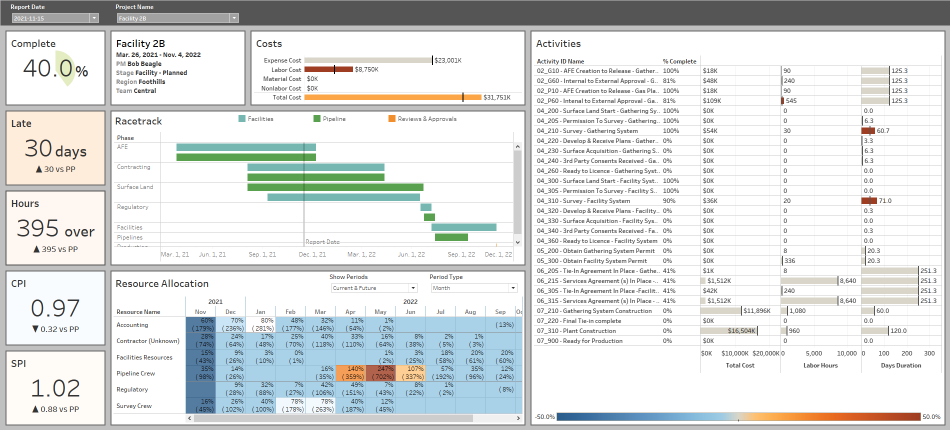
Project Details Dashboard
The project details dashboard allows you to pick any project and understand its status, all without even having to log into P6. The report here is set up using sample data for a portfolio of drilling projects, but it can be customized for any type of project.
KPI Cards
The cards along the left side give you a quick overview of your key performance indicators: days late, labor hours over/under, cost performance index (CPI) and spread performance index (SPI). In addition, they tell you how things have changed since the previous period. In this report, the previous period is the past month, but you can get these values for the past quarter, past week or even since yesterday. You can't do this with live reporting off of the database; P6-Reporter captures the state of you projects at intervals chosen by you, so that you can do comparisons like these.
Stats Card
See the name of the project, its start and end dates, and all of those other helpful stats that don't always fit into a chart. P6-Reporter allows you to capture any code or UDF in P6 and get them into the reporting tool of your choice.
Costs Chart
See your costs broken down by category. The black vertical line marks the target amount (planned or baseline) and the bar color instantly draws your eye to where the issues are; the darker the color, the higher percentage over the target amount it is.
Racetrack
This chart provides a high level summary of your project's activities grouped by the type of work; it can be thought of as a condensed Gantt chart.
Resource Allocation
See how the percentage hours are allocated to the resources used by your project vs their limit: the percentage allocated to all projects as well as the percent allocated to just yours. The bright colors draw your eye to where the issues lie. You can group the dates by quarter, month, week, or day to take a closer look.
Activities
See all of your activities and how they are performing against your baseline amounts for total cost, labor hours, and duration.
