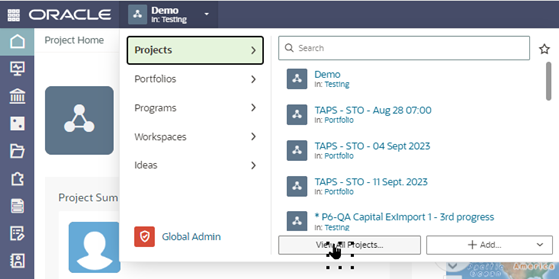
I need to add a project in Oracle Primavera Cloud (OPC) manually (directly). What is the process? In OPC, a project can be created in a few ways: added directly, moved from project proposal to an approved project via a workflow process, copied from a project template, or imported into OPC from an external application.
To add a project directly, we will use the Add Project wizard to add details, user and group access, permissions, and companies to the new project. A new project can be created without data, or you can copy data from an existing project or template. Keep in mind that data stored at the workspace level and relationships between projects are not available to copy.
Access Projects and then View All Projects.
Written by Mary Lynn Backstrom, PMP, PMI-SP, PMI-BA – Implementation Specialist
on Thursday, 16 May 2024.
Posted in All Articles, Oracle Primavera Cloud (Prime)
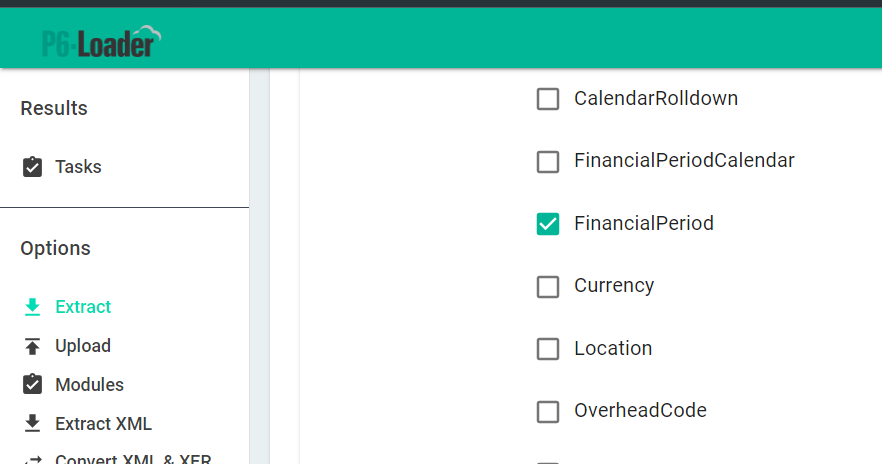
Financial periods must be created manually in P6. It is a tedious process mainly because it seems that it would be so easy to automate it! Well, with the P6-Loader, you can.
In the P6-Loader, the financial period is a global object you can export.
Written by Ravi Wallau - Integration Specialist
on Monday, 06 May 2024.
Posted in All Articles, P6-Loader
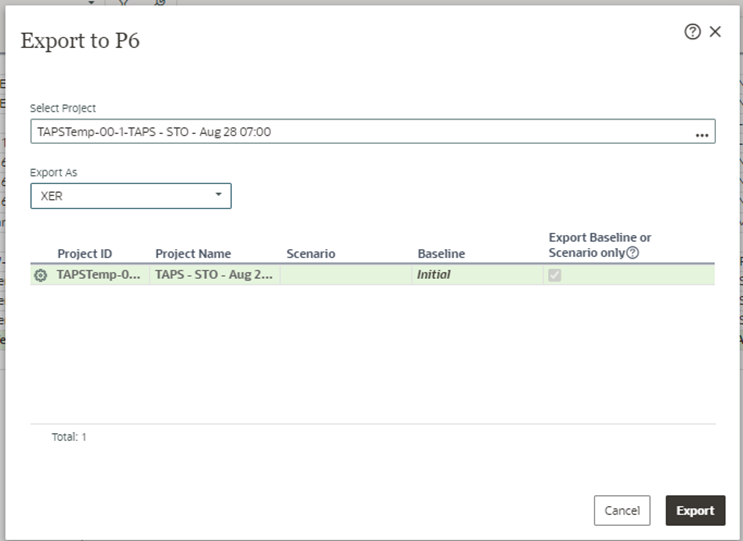
Some new functionality has been added to the new release of Oracle Primavera Cloud (OPC) version 24.4.
The user can now
export baselines and scenarios as projects in XER format. The P6 XER format does not support baselines, and Primavera P6 does not support scenarios, but both can be exported from OPC as projects to be imported into P6 though. This will assist with the Time Impact Analysis and any subcontractor status update processes when contracts require that data be exchanged in XER format.
The Export to P6 dialog now allows selection of baselines and scenarios when Export format XER or Compressed XER is selected. The Export Baseline or Scenario Only is auto checked and read only when a baseline/scenario is selected.
Written by Mary Lynn Backstrom, PMP, PMI-SP, PMI-BA – Implementation Specialist
on Tuesday, 23 April 2024.
Posted in All Articles, Oracle Primavera Cloud (Prime)
Commonly, new activities need to be added to your project as it progresses. What functionality does Oracle Primavera Cloud (OPC) offer to assist as new activities are not automatically added to the project baseline? You need to add the activities to the baseline, so OPC provides functionality to add them from the current schedule. OPC offers functionality to handle updates of the existing baseline with new activities without the requirement of creating a new baseline. When you must carry out this task, you need functionality to assist making the process easy to use as well as not labor intensive. Let’s have a look at what is involved.
Open the Activities page (Schedule App):

Written by Mary Lynn Backstrom, PMP, PMI-SP, PMI-BA – Implementation Specialist
on Thursday, 18 April 2024.
Posted in All Articles, Oracle Primavera Cloud (Prime)
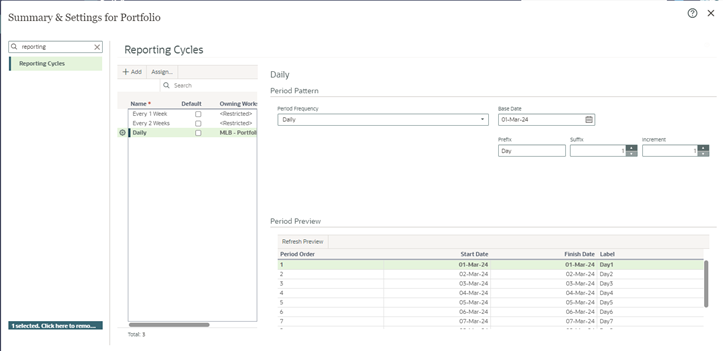
Reporting cycles in Oracle Primavera Cloud (OPC) are defined to create reporting periods used to plan and update progress on scope assignments and to store period performance for schedule activities. Reporting cycles can be set to occur daily, weekly, semi-monthly, or monthly depending on the reporting requirements for a project.
Workspace Report Cycles:
Written by Mary Lynn Backstrom, PMP, PMI-SP, PMI-BA – Implementation Specialist
on Friday, 12 April 2024.
Posted in All Articles, Oracle Primavera Cloud (Prime)
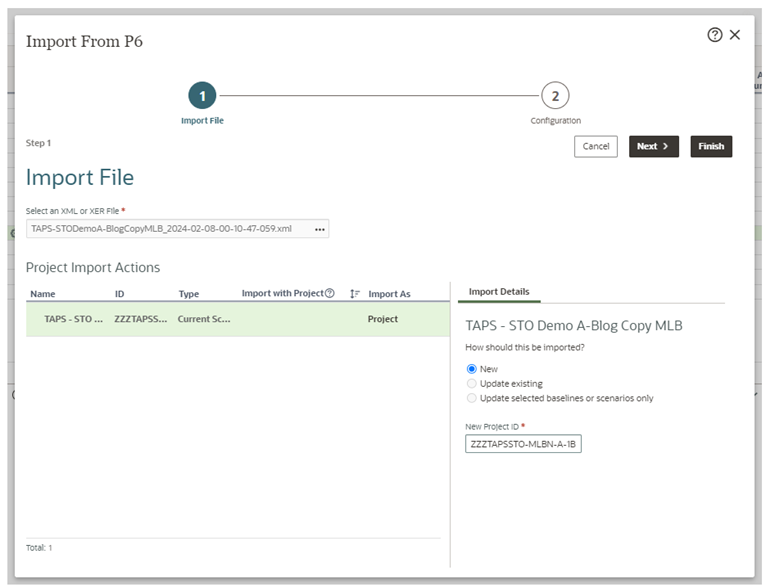
Below are a few of the many updates for Oracle Primavera Cloud (Prime) v24.2. This is not an all-inclusive list of the updates, but a few of the ones you may find helpful.
To start, you can now import a baseline or scenario of a P6 XML to create a new project or to create a scenario or baseline of an existing project. Any associated baseline categories will also be imported. Food for thought: this can provide additional flexibility on how baselines and scenarios are shared between owners, general contractors, and subcontractors.
Written by Mary Lynn Backstrom, PMP, PMI-SP, PMI-BA – Implementation Specialist
on Friday, 05 April 2024.
Posted in All Articles, Oracle Primavera Cloud (Prime)
Range Copy/Range Paste, Project Count, CPP Format Export, Import from Excel
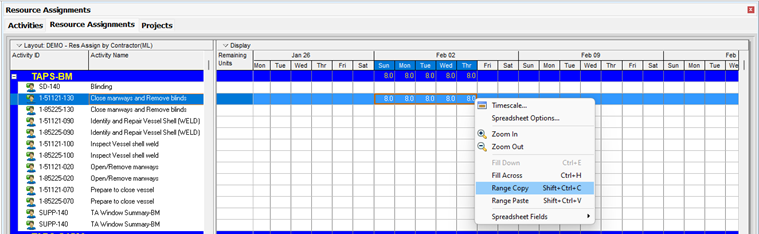
There are several new pieces of functionality in P6 Professional v23.10. We will start with a high level look at a few of the elements. One of the new pieces of functionality added allows users to paste multiple data entries from Excel directly into P6 Professional using range copy/range paste. Copy/Paste of a range is available in both directions: Excel to P6 or P6 to Excel. From P6 to Excel select the range, right click and select Range Copy (or use Shift+Ctrl+C), and then paste the range into Excel.
From P6 to Excel select the range, right click and select Range Copy (or use Shift+Ctrl+C), and then paste the range into Excel.
Written by Mary Lynn Backstrom, PMP, PMI-SP, PMI-BA – Implementation Specialist
on Tuesday, 26 March 2024.
Posted in All Articles, Primavera P6
Have you seen these new features? They were added in Primavera EPPM version 23.10.
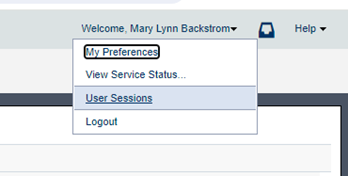
Additions to Viewing Current & Recent User Sessions
By selecting the User Sessions page from the User Menu, users can view information about their recent sessions.
Written by Mary Lynn Backstrom, PMP, PMI-SP, PMI-BA – Implementation Specialist
on Friday, 16 February 2024.
Posted in All Articles, Primavera P6
Easier Hierarchies and Fragnet Templating
Written by Ravi Wallau

Easier Hierarchies and Fragnet Templating
New Features
-
Easier to work with hierarchical fields - WBS, Resources, Roles, Codes, EPS, OBS, and Cost Accounts.
-
Full path extracting and loading for all hierarchical codes makes working with these hierarchies easier in Excel. Several new fields were added including the full code path field and a field showing the level of the hierarchy. This makes building hierarchies in Excel easier and loading them into P6 less error prone. Separator definitions are now also configurable.
-
Allows importing of WBS with their codes (without needing the path) if they are unique across a project
-
WBS template fragnet loader - You can take advantage of WBS templates built in P6 within P6-Loader to copy WBS nodes, activities, resources assignments, logic, steps, and expenses from one or many templates and fill in any placeholders for activity ID and names as you generate new WBSs into your project. You can also assign UDFs and codes to WBS, activities and resource assignments while applying a template. This is like the old P3 Fragnets on steroids.
-
Improving the handling of spread information to allow quarterly and yearly spread extractions are back. Manual spread loading of these spread periods is not supported.
-
Automatically starts activities when loading resource assignment period actuals.
Enhancements
-
Better error handling with the API when loading batches and better controlling of batching.
-
Includes project names and activity names in the relationship sheet when extracting.
-
Fixes a problem that would occur when trying to extract project data with no projects selected.
-
Better use of UI space in the bottom toolbar.
on Friday, 09 February 2024.
Posted in News, P6-Loader
Let’s take a quick look at the Check Schedule Toolbar functionality in P6 v23.12.1. (This toolbar was put into P6 in v22.4.)
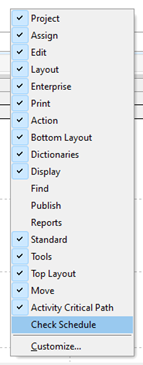
Enabling the Check Schedule toolbar displays the toolbar icons below.

Working across the Check Schedule toolbar, the functions behind the icons are shown.
Written by Mary Lynn Backstrom, PMP, PMI-SP, PMI-BA – Implementation Specialist
on Friday, 02 February 2024.
Posted in All Articles, Primavera P6
Your P6-QA metrics are now available in Power BI reports. You can also create custom reports via our P6-Reporter tool in your corporate dashboards. These reports include time based metrics to help you see where in your project these quality issues exist.
Written by James Andrade

Your P6-QA metrics are now available in Power BI reports. You can also create custom reports via our P6-Reporter tool in your corporate dashboards. These reports include time based metrics to help you see where in your project these quality issues exist.
New Features
-
New UDFs to show variances and calculated values - P6-QA may report that you have activities that are overdue for updating, but are they over by 2 days or 2 months? And what is your project's critical path length index (CPLI) exactly? Now you can view these metrics right in P6 to know how close they are to your target values.
-
Indicators for resource assignments - P6-QA has reported you have resource assignments that are missing roles, actuals or perhaps are over budget. In this release, we've added indicator UDFs. P6-QA populates them to let you find the affected resource assignment with ease.
-
P6-Reporter Ready - We've added custom tables to our P6-Reporter tool that neatly arrange your P6-QA data, including all of the inspection details, so it's ready to be put into the reporting software of your choice.
-
P6-QA statistics can now be pushed into time-based graphics. Being able to critique different portions of your schedule to get a much better idea of the risks and timing of those risks.
on Tuesday, 30 January 2024.
Posted in News, P6-QA
Primavera P6 utilizes CPM or Critical Path Method Scheduling. Using the activity information in a P6 schedule file, the early and late dates are calculated when the project is scheduled. P6 uses the activity durations and the relationships between the activities to calculate schedule dates. The schedule calculations are completed in two passes: the forward pass in the scheduling process calculates the early dates of each of the activities and the backward pass calculates the late dates. If the activity information (durations or logic) in your P6 schedule is incomplete or incorrect, scheduling results will be affected.
Written by Mary Lynn Backstrom, PMP, PMI-SP, PMI-BA – Implementation Specialist
on Friday, 05 January 2024.
Posted in All Articles, Primavera P6
Recently, a client of ours was using P6 Pro Client with P6 Pro Cloud Connect and had the caching option enabled. This user was using an older version of P6, 18.8, and in this version, problems with P6 Pro Cloud Connect were much more common than in the current version. The user would log into P6, logging in would take a few seconds, and then P6 would just crash. We checked the user configuration and disabled caching, and the user was able to login into P6 after that.
However, the user soon noticed that some of the projects he was working on were gone. What happened?
Written by Ravi Wallau - Integration Specialist
on Wednesday, 13 December 2023.
Posted in All Articles, P6-Loader
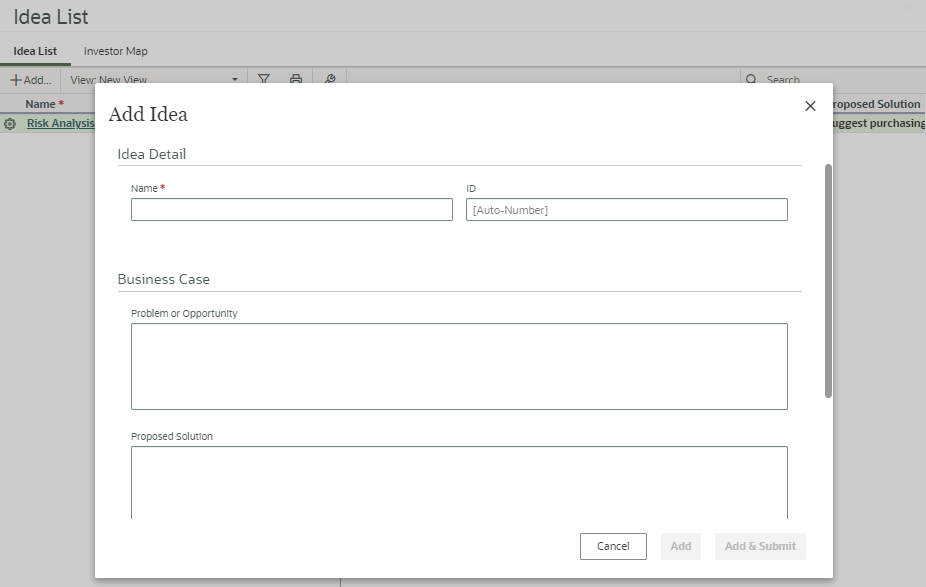
The Ideas functionality in Oracle Primavera Cloud (OPC) allows for the submission of ideas which are then tracked, processed and evaluated. This assists with selection from the submissions, ideas to accept and potentially implement as projects. Each idea is registered, submitted, and then the idea is displayed in the Idea List.
Written by Mary Lynn Backstrom, PMP, PMI-SP, PMI-BA – Implementation Specialist
on Wednesday, 06 December 2023.
Posted in All Articles, Oracle Primavera Cloud (Prime)
Easily Manage Key Resources and Mandatory Activities in P6!
Written by Ravi Wallau

Easily Manage Key Resources and Mandatory Activities in P6!
New Features
-
Custom field copy - copy custom fields from the primary resource into the activity that holds it, or assign a value in a UDF or code based on the calendar the activity has selected. The rules are fully customizable, and it is possible to create match rules using regular expressions.
-
Required objects feature - check if your project has required objects based on pre-defined rules in the program, and fix the problem if possible or alert the user if that is not possible. For example, WAIT activities with a pre-defined duration and name format.
-
Global change feature - apply changes to project data based on pre-defined rules. For example, change the relationship type from the WAIT activity into its milestone's successors from SF to FF, once the milestone activities have reached a certain status.
-
Resource rate import - allow resource rates to be imported from an external system and applied as new resource rates to the resources, matching on resource codes. Shifts are taken into consideration if they are being used.
-
Dictionary synchronization - in some organizations you may have a project code and an activity code that must have the same values. With this feature, you can define a source code and the code values are synchronized to the target codes. The dictionaries are kept in sync, and if a value is moved in the source hierarchy, it is also moved in the target hierarchy.
-
As part of dictionary synchronization, it is also possible to copy the resource tree as a resource code dictionary.
-
Code assignment copy based on certain rules - for example, you can assign a code in the activity based on a corresponding code value in the primary resource for that activity.
P6-Calculator News Articles
P6-Calculator Case Studies
on Friday, 01 December 2023.
Posted in News, P6-Calculator
