In this article I will visit some of the data a user may be utilizing in Primavera P6 and how it is handled or not handled in Oracle Primavera Cloud (OPC). These are some of the differences found that may be of interest to current Primavera P6 users.
Written by Sue Fermelia - Implementation Specialist
on Sunday, 23 April 2023.
Posted in All Articles, Oracle Primavera Cloud (Prime), Primavera P6
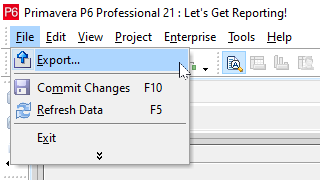
There are many approaches to creating reports from your P6 data, and while free always sounds like the right price, we all know that you get what you pay for. Before you choose an approach, you owe it to yourself to fully assess its strengths and weaknesses. In this article, we’ll compare reporting using XER files versus our own tool: P6-Reporter.
Written by James Andrade - Integration Specialist
on Sunday, 09 April 2023.
Posted in All Articles, P6-Reporter
In executing any type of project, whether it’s a turnaround, construction, manufacturing or other project type, they all benefit from access to quick and current reporting in an easy to digest format. This not only improves project reporting but project communication as well, keeping the team up-to-date with project progress and any issues. With access to self-serve dashboard reporting, the user can easily filter to display the exact data they need to focus on. To deliver reporting for your projects, a reporting tool that is quick to deploy and offers a number of standard reports makes roll out easy. The tool should allow you to produce reports easily on spread data as well, which allows you to compare forecasts captured at different points in time. P6-Reporter offers all of this and more.
Written by Mary Lynn Backstrom, PMP, PMI-SP, PMI-BA – Implementation Specialist
on Friday, 24 March 2023.
Posted in All Articles, P6-Reporter
Your project schedule has been created with no resource curves incorporated. (Resource curves are not always required.) Suddenly, during project execution and reporting, the project is displaying issues. Budget labor, actual labor units and at completion labor units are out of sync. In checking your schedule, it is one section of the schedule which looks to be displaying the issue. You find one of the schedulers has added resource curves to activity resources. At the time of the change, a number of the activities already had progress posted to them. What can happen when resource curves are added or changed after progress has been posted to activities? (Please note this is an example of what can happen given the settings and information scenario that was present at the time. My intent is purely to share what can happen.)
Written by Mary Lynn Backstrom, PMP, PMI-SP, PMI-BA – Implementation Specialist
on Thursday, 09 March 2023.
Posted in All Articles, Primavera P6
In version 6, we added notebook type scrubbing and also made improvements to the P6-Scrubber user interface, reports and functionality in general.
Notebook type scrubbing, improved UI
Written by Ravi Wallau

In version 6, we added notebook type scrubbing and also made improvements to the P6-Scrubber user interface, reports and functionality in general.
Enhancements
-
Option to hide users starting with "zz" from the user list, as well as users with no global access to P6
-
Additional safeguards around editing configuration profiles to prevent accidental overwrites
-
Scrub report improvements
-
Up to 10 times faster XER/XML import operations, and up to 5 times faster scrubbing operations
P6-Scrubber News Articles
on Monday, 27 February 2023.
Posted in News, P6-Scrubber
Green up reports can be configured on the specifics required by your project. By using P6-Reporter self-serve dashboards, you and your project teams can have current, easy to digest project information including overall status and highlights for issues requiring immediate attention. Keep in mind that the green up dashboard examples below are meant as food for thought. These examples may be reflecting exactly the items you need to track in your project(s), or you may need to track entirely different elements. Green up reports can be created for the specifics your project teams require whether it is easily tracking manufacturing stages, distribution status, inventory completion status, machine service cycle completions…the list goes on. A green up report can be configured to track many different schedule items.
Written by Mary Lynn Backstrom, PMP, PMI-SP, PMI-BA – Implementation Specialist
on Friday, 24 February 2023.
Posted in All Articles, P6-Reporter
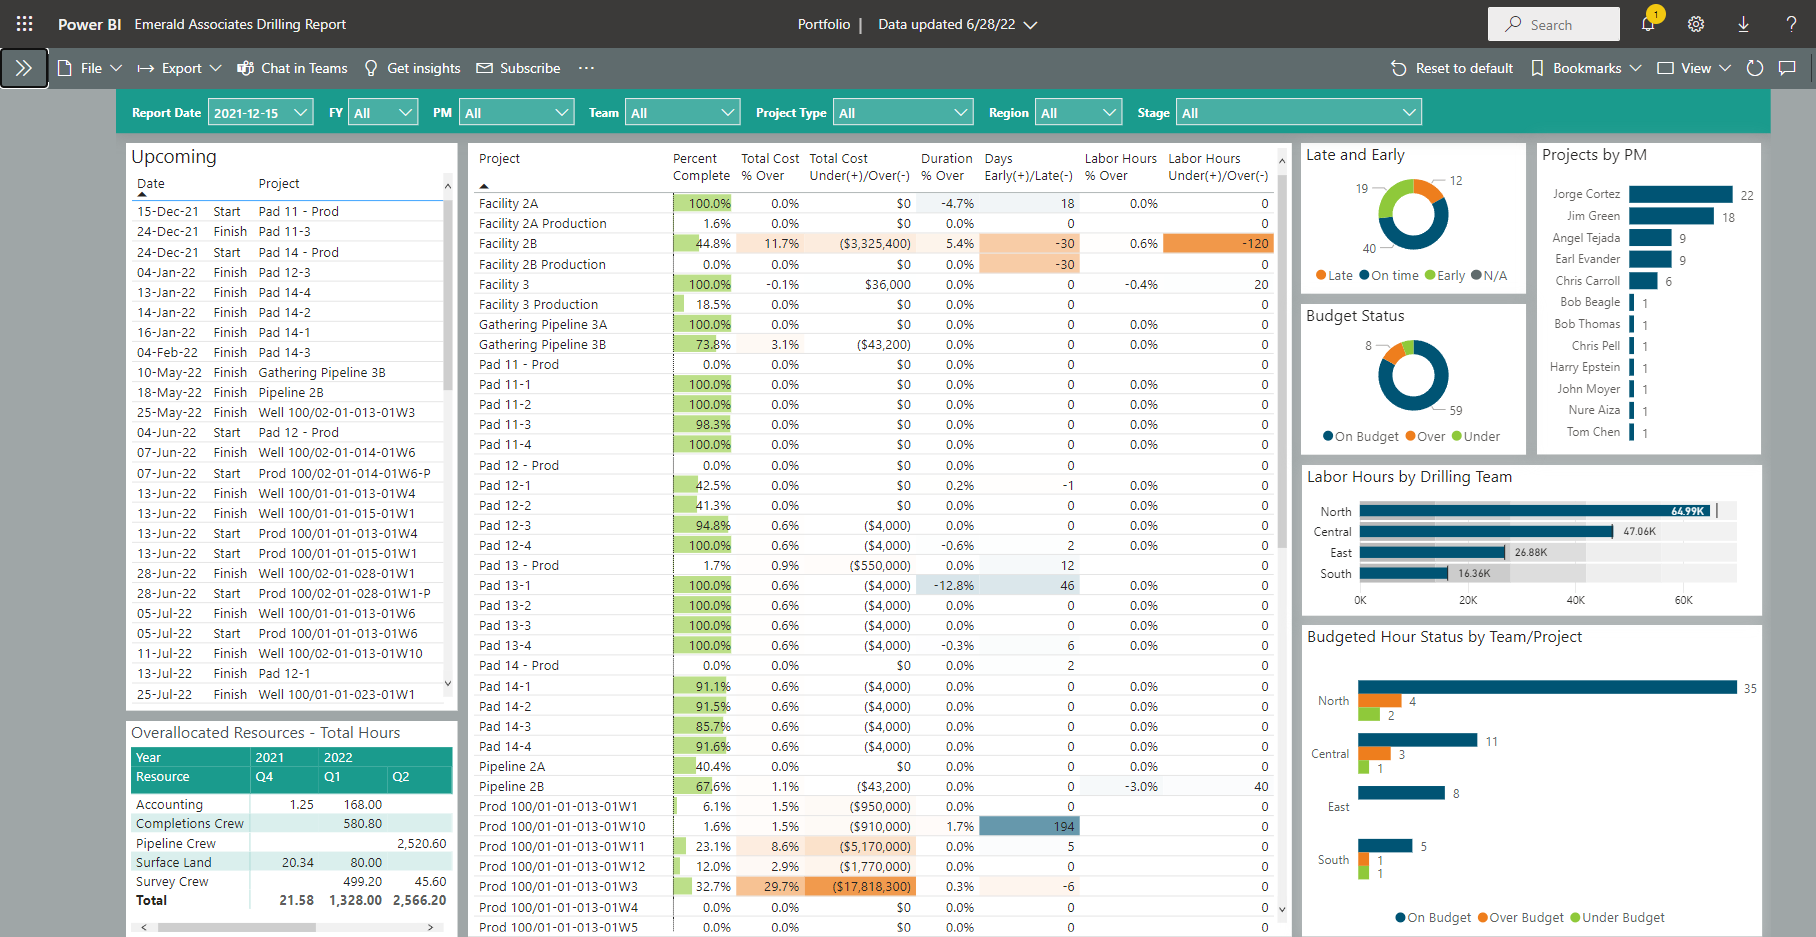
Above is an example of a Portfolio Dashboard available in P6-Reporter that is displayed using Power BI. Self-serve dashboards provide easy access to data in a very easy to digest format. Notice the gradient color coding in these Portfolio screen shots that help focus on issues quickly. Easily re-sort column data by simply clicking on the column headers. Select graph elements and the column elements that are connected to it automatically filter to highlight on the dashboard. (see below)
Written by Mary Lynn Backstrom, PMP, PMI-SP, PMI-BA – Implementation Specialist
on Friday, 17 February 2023.
Posted in All Articles, P6-Reporter
Your project schedule will be created in P6, and you are looking to provide the best schedule tools for your project team. What can you add to your team tool kit to assist the project team, address building the schedule, monitor schedule quality, utilize options for updating the schedule and make reporting quick and easy? Let’s look at a few examples for some food for thought.
Written by Mary Lynn Backstrom, PMP, PMI-SP, PMI-BA – Implementation Specialist
on Friday, 10 February 2023.
Posted in All Articles, P6-Loader, P6-QA, P6-Reporter, TAPS
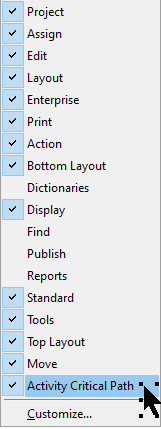
In the P6 toolbars choices, an Activity Critical Path toolbar is now available. Let’s have a quick look at the icons.
Written by Mary Lynn Backstrom, PMP, PMI-SP, PMI-BA – Implementation Specialist
on Friday, 03 February 2023.
Posted in All Articles, Primavera P6
Easily Manage Key Resources and Mandatory Activities in P6!
Written by Dan MacMillan

Easily Manage Key Resources and Mandatory Activities in P6!
New Features
-
Groups related projects together.
-
Analyzes the order in which key resources move between projects and groups in P6.
-
Automatically builds and maintains a project code hierarchy that shows the groups and projects in the order in which key resources visit them.
-
Automatically builds and maintains logic between projects and between groups that models the movement of these key resources.
-
Automatically adds or removes optional activities on the first or last project in a group to represent resource setup or teardown time.
-
Flags projects with an alert indicator UDF if required activities are missing.
Enhancements
-
A key resource could be a rig, a crane, or any other major equipment or resource that you want to optimize the utilization of.
-
Multiple key resources can be managed.
-
You control what defines a group of projects.
-
Different rules for building logic can be defined for resource moves within a group and resource moves between groups.
-
You control how projects are sorted to determine the order in which each key resource moves between them.
-
The project code dictionary, logic, and optional activities automatically adapt to changes in project order.
-
You control which projects are checked for mandatory activities.
P6-Calculator Case Studies
on Tuesday, 31 January 2023.
Posted in News, P6-Calculator
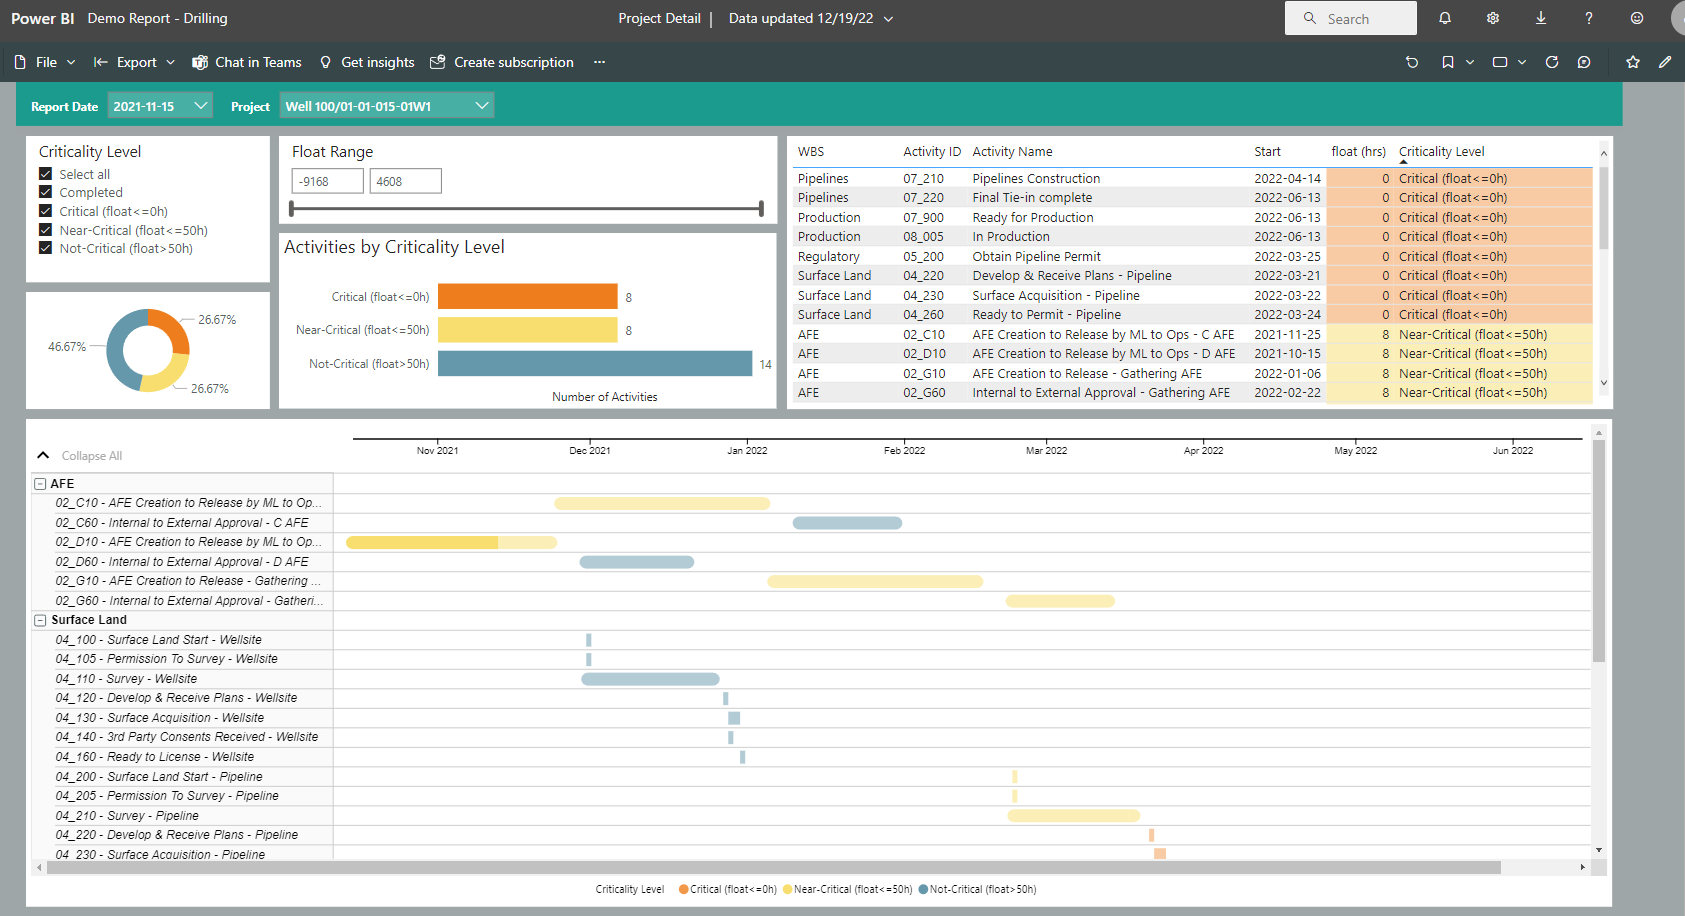
Do you have project critical path status information at your fingertips? Your project teams need current criticality information to make timely, informed project decisions. Delayed decisions or basing decisions on old information can be costly to your projects.
Using the new criticality report now available with P6-Reporter, the current criticality information will always be at your fingertips. Use the filters to choose the file and snapshot required. Keep in mind, the snapshot process can be carried out manually or be automated.
Written by Mary Lynn Backstrom, PMP, PMI-SP, PMI-BA – Implementation Specialist
on Friday, 27 January 2023.
Posted in All Articles, P6-Reporter
In P6, identifying each specific project using each UDF in a quick, consolidated, easy to use manner can be very challenging. With ten subject areas where UDFs can be created and the ability to create an unlimited number of UDFs, the complete list of UDFs in a P6 database can be very large. The ability to quickly create a consolidated report telling you exactly which project each UDF is being used in can be very useful.
Written by Mary Lynn Backstrom, PMP, PMI-SP, PMI-BA – Implementation Specialist
on Saturday, 21 January 2023.
Posted in All Articles, P6-Loader
Often on a Turnaround, or any large project, you need to report resource availability and requirements in your schedule by Craft (trade) and Company. But often, that’s not how the resource dictionary hierarchy is set up. How do we solve this problem? Well, an easy solution to the reporting requirement is using resource codes.
Written by Mary Lynn Backstrom, PMP, PMI-SP, PMI-BA – Implementation Specialist
on Thursday, 12 January 2023.
Posted in All Articles, Turnarounds
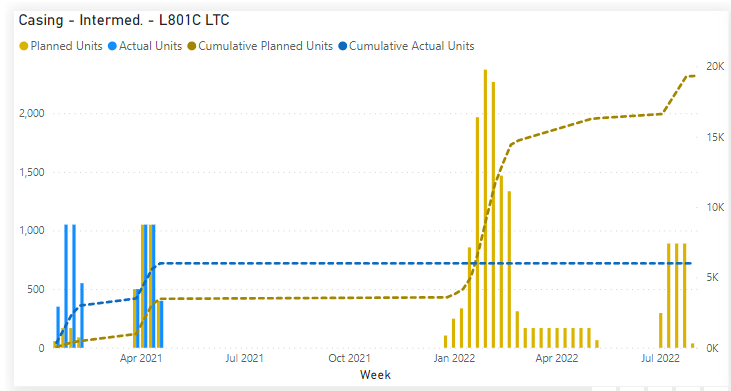
Can you readily monitor commodities on your P6 projects? For example, if your business is oil and gas, can you readily track the requirements of casing or the production levels of oil? For tracking your projects, consider self-serve dashboards for your portfolio of projects.
Written by Mary Lynn Backstrom, PMP, PMI-SP, PMI-BA – Implementation Specialist
on Monday, 09 January 2023.
Posted in All Articles, P6-Reporter
How are you reporting summary progress information on your project? For example, how are you tracking and reporting inspections? Does your team have access to Valve, Exchanger or Piping Summaries in their project reporting dashboards? Provide your team access to easy to digest status reports on progress specifics on your project that are updated using automated snapshots in P6-Reporter (previously EP-datawarehouse). The added information availability is not an extra task that your team needs to spend time on. Once the regular updates to your schedule are completed/reviewed/analyzed, a snapshot of the project is taken. The snapshot process can be automated or you can do it manually if you prefer. The snapshot provides the current information to P6-Reporter dashboard reports. The information the dashboard user views are the latest available from the snapshots. Have regular snapshots of your projects to feed dashboard reports which work to streamline the reporting process. This ensures all team members have access to the most current information with no printing and/or emailing of the reports required for distribution. Previous snapshots are available for easy access if required in P6-Reporter self-serve dashboards; just change the Report date in the drop down menu. Below are some examples of Summary reports displayed in Tableau. Similar reports can be displayed using ODV and Power BI as well.
Written by Mary Lynn Backstrom, PMP, PMI-SP, PMI-BA – Implementation Specialist
on Wednesday, 28 December 2022.
Posted in All Articles, P6-Reporter


